When spectrum licenses change hands, as it did recently with the SpaceX/Grain Management 800MHz spectrum sale, the most common way to value the spectrum is “MHzPOPs”. The metric is a very straight forward way to value spectrum based on the amount of radio bandwidth, measured in MHz, and the population that the license covers.
MHzPOPs = Bandwidth (MHz) × Population covered
When industry analysts talk about the value of spectrum for completed deals or prospective one, they’ll often look at the most recently sold licenses in that same spectrum band (700MHz, PCS/AWS, etc.) and compute the MHzPOPs for those licenses as a starting point of measuring the value of that spectrum.
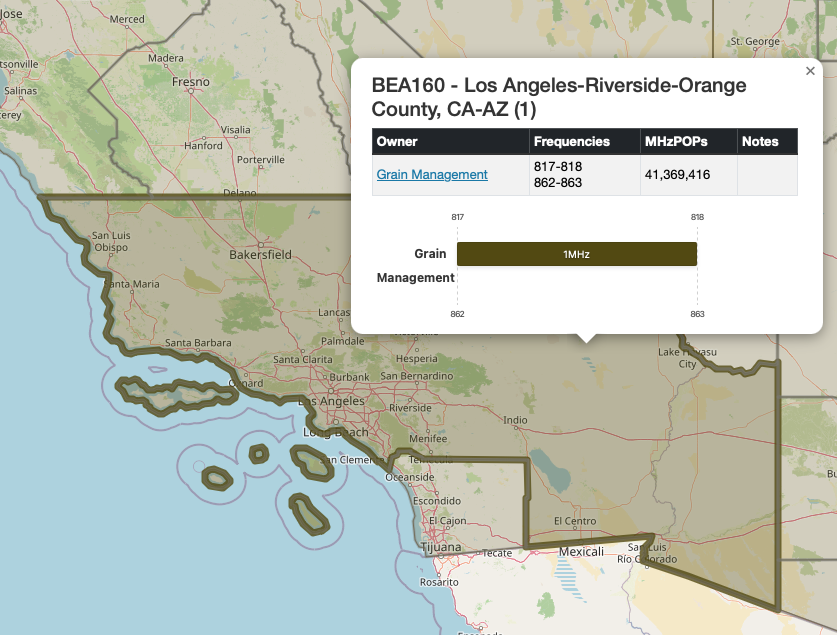
This is useful because a 20MHz block of spectrum that covers the New York City or Los Angeles areas are much more valuable than the same 20MHz covering Topeka, KS (sorry Topeka, no offense intended), even if its the same geographic area. The population covered by the license makes the difference.
To generate this figure, we are using the most recent decennial US Census Bureau data (2020) at the Census Block level. Census Block centroids, when intersected with the license boundary polygons provide a close estimate of the population covered by the license. Multiplied by the MHz the license owns provides a MHzPOP figure.
This data is available through the Forward Path Market Area, County, and License Boundary Maps subscription, as well as available through Bulk Data downloads for County and License Boundary data (contact us if interested in bulk data).