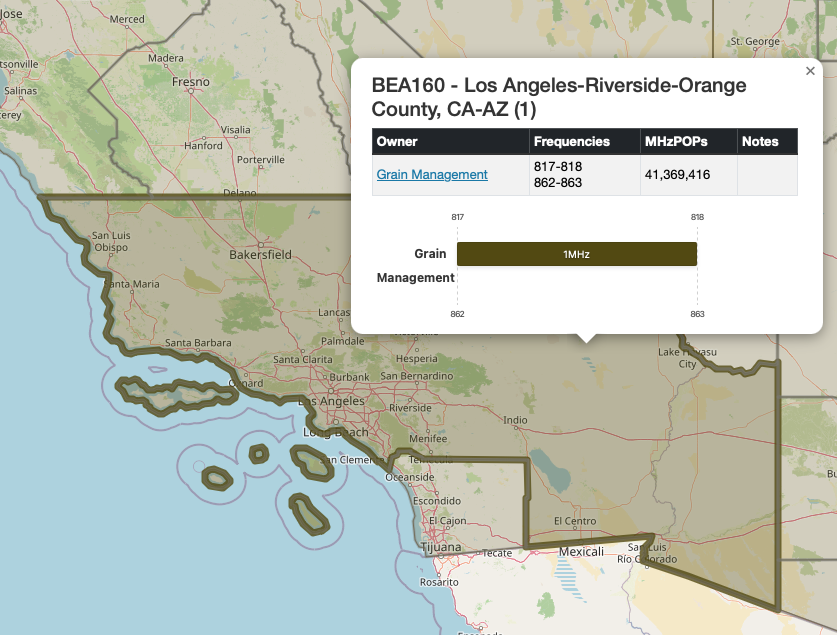
When spectrum licenses change hands, as it did recently with the SpaceX/Grain Management 800MHz spectrum sale, the most common way to value the spectrum is “MHzPOPs”. The metric is a very straight forward way to value spectrum based on the amount of radio bandwidth, measured in MHz, and the population that the license covers.
MHzPOPs = Bandwidth (MHz) × Population covered
When industry analysts talk about the value of spectrum for completed deals or prospective one, they’ll often look at the most recently sold licenses in that same spectrum band (700MHz, PCS/AWS, etc.) and compute the MHzPOPs for those licenses as a starting point of measuring the value of that spectrum.
Spectrum License owned by Grain Management, including MHzPOPs data
This is useful because a 20MHz block of spectrum that covers the New York City or Los Angeles areas are much more valuable than the same 20MHz covering Topeka, KS (sorry Topeka, no offense intended), even if its the same geographic area. The population covered by the license makes the difference.
To generate this figure, we are using the most recent decennial US Census Bureau data (2020) at the Census Block level. Census Block centroids, when intersected with the license boundary polygons provide a close estimate of the population covered by the license. Multiplied by the MHz the license owns provides a MHzPOP figure.
For three months earlier this year, I put Verizon and AT&T’s 5G Home Internet to the test. There was one clear winner.
Background & Setup
First, let me say that I am in a fortunate enough position to be able to test the two services head-to-head on what I consider to be equal footing. I am roughly the same distance (but in different directions) to both a Verizon 5G tower, and a brand new AT&T tower (constructed in 2025). The AT&T tower is clearly visible out of the second-floor window where both modems were placed during testing, while the Verizon tower is far off center (75 degrees east). Both towers are approximately 500-600 feet away from my house with no obstructions between the tower and my window. Ideal conditions for 5G Home Internet.
The Verizon 5G modem was replaced in June of 2025, so is relatively recently hardware. The AT&T modem was acquired in April of 2026 from them. Both were connected via ethernet when being tested from a desktop computer, and Wi-Fi when tested from a phone or laptop.
In my market (Las Vegas, NV), Verizon owns 160MHz of C-Band spectrum, and AT&T owns a total of 150MHz of spectrum: 70MHz of 3.45GHz (including Dish’s spectrum it leased at the time and was in the process of acquiring) along with 80MHz of C-Band spectrum.
Expectations
Verizon advertises the service as having speeds of up to 300Mbps down and 20Mbps up.
AT&T advertising the service as having speeds of 300Mbps down and 30Mbps up.
Both providers do not have broadband caps, so there is no monthly transfer limit or overages. However the carriers can throttle or deprioritize your traffic if needed during peak times.
Performance
The Verizon performance matched their stated performance benchmarks the vast majority of the time I was using the service. I would regularly see speed tests at or slightly in excess of 300Mbps down and 20Mbps up.
Verizon also noticeably rate limits their 5G Home internet – on my iPhone I can get 5G speeds over 1,000Mbps (1Gbps) down. However in the exact same spot a minute later the fastest the 5G Home internet will go is slightly over 300Mbps.
AT&T had a more difficult time living up to their stated performance goals, especially for download speeds. Speeds typically ranged between 180-220Mbps down, lower than the 300 estimated in their Broadband Facts sticker. However upstream was very reliable – 25-40Mbps.
AT&T’s speeds were also inconsistent. When I first got the modem, the speeds were very strong – ranging from 300-500Mbps, occasionally even faster than that. However after a few weeks they started slowing down, and two months into testing I rarely saw any download speeds above 250Mbps. I attribute this to increased network load as AT&T is putting more Internet Air customers on the network. In July 2026 they announced that they doubled their subscriber count from 1 million to 2 million Air customers in about 12 months, twice as fast as they went from 0 to 1 million customers (24 months). There was also a door-to-door salesman in the neighborhood for AT&T Internet Air and Phone service when the new tower was activated. The tower and my modem were both brand new so I don’t think it was equipment at either end. Modem reboots and changing what few settings I could did not solve the problem of slowing speeds.
Pricing
AT&T’s price for their internet offering is relatively straightforward (as much as they can be these days). The price is starts at $65/mo, but drops to $55/mo including an auto-pay discount. It goes down to $35/mo with a qualifying AT&T mobile phone plan.
Verizon’s pricing is more complex. It used to be as simple as AT&T’s when I signed up in 2022 – $25/mo if you have a Verizon mobile phone plan and sign up for auto-pay. Now, there are three tiers of varying speeds which vary in price depending on auto-pay and if you have a qualifying Verizon Wireless service. It might just be easier to show this in a table…
Verizon Plan
Price (Stand Alone)
Price (with VZ service)
Download/ Upload Speeds
5G Home
$50/mo
$35/mo
100Mbps / 10Mbps
5G Home Pro
$60/mo
$45/mo
150Mbps / 15Mbps
5G Home Ultimate
$75/mo
$60/mo
300Mbps / 20Mbps
As of August 2026
On a dollar-for-dollar basis AT&T is the cheaper plan for the promised speeds. But the better deal comes down to who has the better signal and network capacity at your house.
Conclusion
When I am asked about who has the best mobile phone network is in 2026, I typically respond with “whoever has the best signal where you live and work.” That advice stands strong with 5G Home internet – if you get great signal in your area with your current mobile phone service you might want to take a look at their 5G Home internet. While the speeds aren’t as fast as cable or fiber, I’ve never had a problem with the throughput in the more than four years working from home with Verizon’s 5G. I’d switch to fiber if I had the chance, but since it isn’t available at my house. My only other high speed option is cable at $125/mo for gigabit speeds that have a 1.25TB/mo transfer cap, I’ll stick with much cheaper 5G Home Internet with no monthly data bandwidth caps or overages.
Final Note: I would have loved to also included T-Mobile 5G home internet in this comparison as well, especially since their tower is right next to Verizon’s tower about 600′ from my house. Unfortunately I was not able to sign up as there is a waiting list in my neighborhood.
Hello and welcome to Forward Path! After over 14 years as “Spectrum Omega,” we are thrilled to announce an exciting transformation. Our spectrum maps have evolved to include licensed footprint areas, marking a significant milestone after three years of dedicated development.
To better serve our users, we are changing our licensing model to better enforce our “Freemium” model launched back in 2020. While FCC Licensed Area maps will continue to be available for free for non-commercial users, commercial users will need to sign up through a subscription to access these maps.
This shift allows us to invest in the necessary cloud data processing tools and resources to generate high-quality datasets every week.
New Features & Improvements
As mentioned above, the system now generates License Footprint areas – the geographic boundaries of each license is computed based on data from the FCC each week.
This also includes computing the effective available geographic boundary for BRS/EBS “Overlay” licenses – as the FCC has licensed this spectrum in such a way that licenses overlap with each other, but licenses that were issued first (P35 GSA, BTA) in the 1990s and 2000s take precedence over more recently issued licenses (county, tribal area).
License Applications are now included in the system as well, showing which licenses have applications pending for transfer/leases.
Subscription Options
There are four levels of subscriptions to the data here at Forward Path.
Tier 1 – Free for personal use (hobbyists) only, licenses are aggregated into FCC Licensed Areas (BTA, CMA, etc.) and displayed visually on the map, along with the Depth Chart that shows the full spectrum depth chart of a particular county. Usage of this tier is monitored for violations of the personal use limitations, and the maps and depth chart are watermarked.
Tier 2 – For commercial or government use, licenses are aggregated into FCC Licensed Areas (BTA, CMA, etc.) and displayed visually on the map, along with the Depth Chart that shows the full spectrum depth chart of a particular county. This is the entry-level commercial option.
Tier 3 – Licenses are displayed at the County (or County-equivalent) level, along with Depth Charts and FCC Licensed Areas.
Tier 4 – Licenses are displayed based on their actual geographic boundary as provided by the FCC. This includes the computation of the BRS/EBS effective license areas. This tier also includes County, Depth Chart, and FCC Licensed Area maps as well.
Subscriptions are managed through Memberful.
The old website will be winding down shortly, so if you are ready to explore the new platform, click here to view pricing and choose your tier!
The FCC finally received authorization from Congress and the White House to issue licenses from Auction 108 (which happened almost two years ago). T-Mobile won the vast majority of these licenses.
The licenses were issued on Leap Day (2/29/24) but didn’t flow into the map automatically because the FCC insisted on organizing the data differently for those licensees in the database.
Additionally, the FCC licensed the Auction 108 areas based on county boundaries. However, those boundaries changed over time, and the county boundaries of 1990 (which serve as the baseline for BTA, the license area type for EBS/BRS) are different from today. So, additional work needed to be done to roll back any county boundary or name changes from today to 1990 (looking at you Alaska, revamping a third of your state’s county boundaries!).
Finally, as a reminder, these licenses are overlay licenses. While you see them attached to counties, and the FCC ULS Maps may indicate an entire county, they are limited based on previously issued licenses for the same frequencies.
BRS and EBS licenses are licensed in a variety of ways (and the upcoming Auction 108 will add another way – counties). One of the way they’re licensed is a Point-Radius method referred to as P35 (point and a 35 mile radius). Licensees define a point, and have the 35 mile radius around that point as their licensed area. However there are lots of cases when those licenses overlap. Which can make it tricky to know which license is the correct one for a given location.
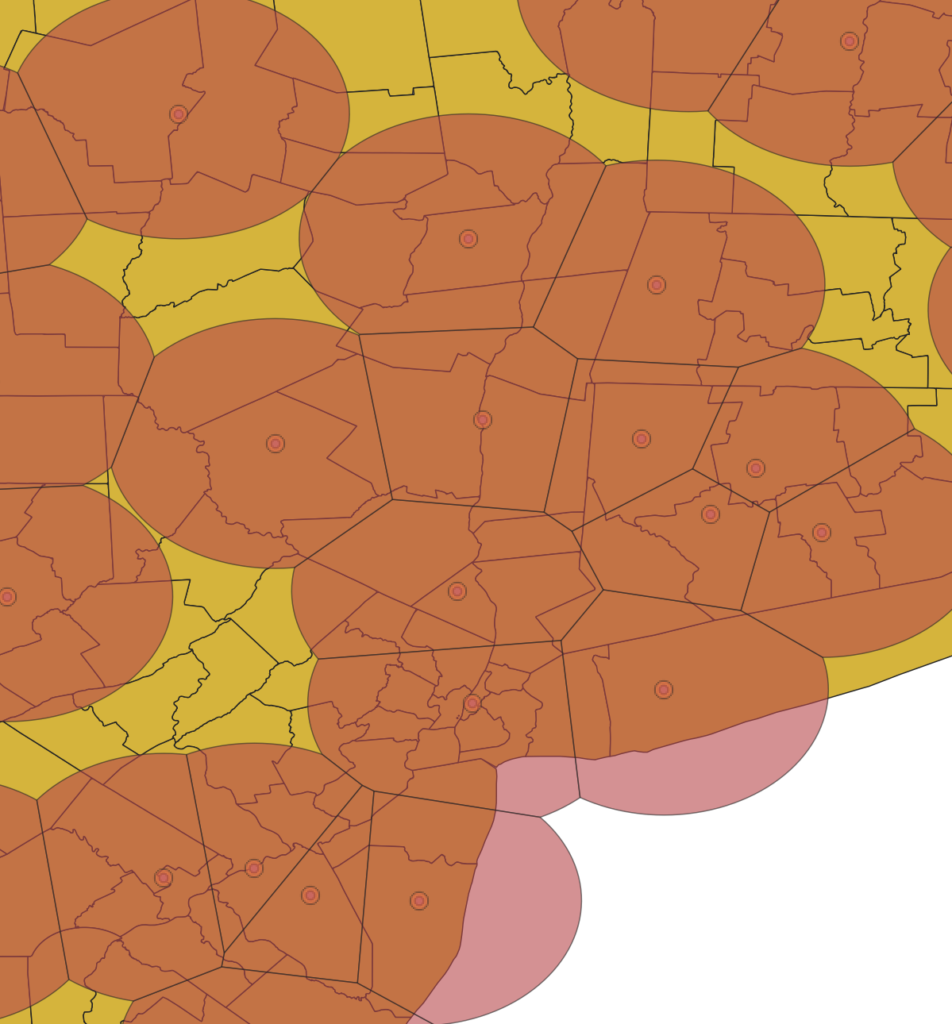
Using a “splitting the football” technique to intersect P35 point/radius license areas, I am better able to determine the county/license relationship. Counties in metropolitan areas will have less noise and more signal (ha ha) as far as which licenses are applicable for that area. In very dense areas, like the picture below, you can see that it becomes less of “splitting the football” and more of just trying to determine the midpoint between all the intersecting points and drawing lines through the midpoints to generate a set of boundaries that are correct.
P35 areas in the northeast USA, along with county boundaries
This was a particularly fun problem to solve. It took a while, as the spatial analysis tools in SQL Server weren’t adequate and I had to spin up a different database to accomplish it.
These improvements will be deployed by the end of May!
I’ve nearly completely rewritten the JavaScript for pulling the data, storing it, and generating the geometry for the website. The goal was to reduce the memory and CPU usage of the website (which is probably more impactful on mobile devices and tablets). I’ve also finally ditched KML data files for the geometry base and moved to GeoJSON. The benefit – reduced memory usage!
The old website would start by using about 300-350MB of memory after the initial load, and increase from there. Each map change would add to the memory used (this is known as a memory leak).
The new website starts the same – around 300-350MB of memory, but once the data is stored on disk (instead of in memory) and garbage collection runs in the background, the memory usage decreases and stays between 150-200MB. Even as maps types change and different tabs are used, Chrome indicated that memory usage was still between 150-200MB.
The other update for this month is a small tweak to ownership data – I’m a little more particular about how I go about assigning subsidiaries to the major carriers to try and make sure that they own a controlling fraction ( >= 50%) of the subsidiary before I assign it to them. There are some small cell phone companies out there that have a major carrier (Verizon) that owns a small fraction of the company (10%). But those shouldn’t be assigned to Verizon.
The next few changes are more behind the scenes. Hopefully some more user-facing changes this summer.
If you happen to notice any problems with the new system, please let me know here.
This month I will be adding the new 3.45GHz band (100MHz) to the map as the FCC recently released auction results. I’ve validated that the results posted will work for the map, but it will take a few hours to get it coded and tested. Expect the new layer in a week or two, as most of my house is sick.
I’ve spent the last few months working hard on cleaning up the BRS/EBS data. The more I dug, the more I found I had to correct for.
BRS/EBS
There are very few licenses that still use the “Old” band plan. Virtually all the licenses are using the “New” band plan (there have been many recent conversions, even in the last few months – as I was combing through the data I saw a lot of October and November 2021 dates for some licenses switching from Old to New). Be aware there are still inconsistencies in the FCC’s ULS database – there are lots of licenses where it says they’re using the New band plan but have the Old frequencies associated on the Map view of the license.
I’m convinced at this point that T-Mobile doesn’t own those J/K blocks. I’ve checked everywhere in the FCC data dump and didn’t find any records that showed they own those J/K blocks.
Next on the agenda for BRS/EBS is to start using spatial analysis to “split the football” on overlapping P35 licenses. I used to do spatial analysis for a living so I’m eager to get back into it and figure out how to solve this problem. If I’m successful I do plan on trying to make a BRS/EBS map, but it will be paywalled after a short beta period.
Firstnet
I’ve added AT&T’s Firstnet holdings. However, they still don’t appear in the FCC ULS data dump, so there are no hyperlinks to link back to.
Thats all, have a great holidays and let’s hope 2022 can return us to a little bit more normal times.
Hi everyone. Small bug fix delivered this month. The totals on the Depth chart for mmWave were off, and I’ve corrected the algorithm to total it up. So the numbers should be correct as of today’s data update.
Other issues I am looking into are J/K blocks of EBS/BRS control for T-Mobile (the FCC ULS doesn’t show any license ownership for those blocks prior to 2020’s tribal lands assignment action so I’m not sure T-Mo owns or leases those two small chunks), and improving P35 boundaries using the splitting the football approach the FCC defines for when the two circles overlap.
Finally I’m looking into developing a more detailed EBS/BRS map. Though given the time investment, those features might be paywalled for licensed users only.
By the end of June, I expect that I will be able to post the C-Band auction results. [Update: As of June 17, I have posted the results in map form!] The results will include both the final and interim configuration. If you haven’t heard, Verizon was the big winner, both in terms of spectrum and money paid, getting about 160Mhz of spectrum nationwide. AT&T was next with around 80Mhz, and then finally T-Mobile got about 40Mhz or so in major markets.
Interim vs. Final Configuration
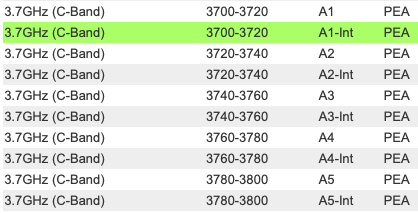
The interim configuration extends from December 2021 to December 2023, and includes the first 100MHz (A block) of the C-Band’s 280MHz available spectrum for cellular use, but only in specific metro areas (the top 50 in the US, excluding Washington DC/Baltimore). This interim configuration was split between Verizon and AT&T 60/40. On the map you’ll see two sets of blocks for the first 100MHz – one block has an “Int” at the end which denotes the “interim” block that has the reduced metro areas as well as assignments for the next two years, as well as the “final” block which has the block name “A1” to show the 2023 configuration.
This spectrum has a lot of potential – greenfield 5G for Verizon and AT&T, and enough spectrum to make 5G seem like 5G, and not just 4G with Sprinkles.
The next auction is the in-fill for the 2.5GHz band. Will T-Mobile extend their dominance, or will small rural carriers try to secure large blocks of mid-band spectrum to deploy rural wireless (fixed wireless maybe?).